Knowledge is power. In a modified car, knowledge of how it is running is vital. If the car is running poorly, it’s fantastic to have some data to assess what exactly the problem might be. Having recently installed a wide band O2 sensor, I don’t think I could ever have performance car without one.
The trouble then comes from the cost and packaging of multiple gauges. I wasn’t interested in having them all over the dash. I was also not using the standard stereo and thought the double DIN slot would be a great place to have a digital display. Surely there must be a shiny Japanese tuning product that put sensors through the engine bay and fed back to a nice double DIN screen in the centre console? Apparently not.
I’m pretty handy with electronics and especially Arduino, so I was very excited to stumble across this video:
An Arduino host driven, touch screen interface with a library of gauges and graphics placed in a simple WYSIWYG GUI. I did some research of the LCD manufacturer, 4D Systems, and decided the uLCD-70DT Display Module in Arduino kit form was right for me. It came with the screen, an Arduino adaptor shield, a programming board and SD card. All I had to do was add a bezel to make sure no gaps would be around the edge in the double DIN slot.
What makes the system so good is that the screen has its own Diablo16 processor on board. You use the ViSi-Genie software to drag, drop, resize, position and style your interface and then compile this onto the SD card. Each element is given a name and index, which is referenced in the Arduino ViSi-Genie library. You write your Arduino code as a normal sketch and use the library to send values to the screen, which is processed and displayed. Basically the screen does the heavy lifting with the graphics and the Arduino is freed up to read sensors and send simple commands to the screen. The LCD is also a touch screen, which means elements can be interactive.
This page will document my development process and contain my source code. If you are new to Arduino it will be daunting but if you are experienced, recreating this display will be a walk in the park. If you just want the source code, scroll to the bottom.
System Overview
My system will work as follows:
- Sensors will be placed around the engine bay where desired.
- Sensors will feed into an Arduino Mega in the engine bay enclosed in a waterproof case.
- An on board wireless module will transmit the sensor values in a predetermined order and interval.
- A second Arduino Mega will be mounted in the dash to receive these values via another wireless module.
- This Arduino Mega will process these values and transfer them to the screen for display.
This strategy has more components but means I don’t have to run cabling through the firewall. In the interests of future proofing, should I wish to add more further inputs, the only wiring changes will be for the new sensor. All other changes are software only, negating the need to reroute cables through the firewall and dash.
Components
- 4D Systems uLCD-70DT Arduino starter kit x 1
- 4D Systems 7 inch black bezel x 1
- Arduino Mega (or clone) x 2
- Arduino Mega prototyping shield x 2
- DS18B20 Waterproof Digital Temperature Temperature Sensor Thermal Probe x 4
- 150psi oil pressure sensor x 1
- 3 pin waterproof connectors x 5
- 2 pin waterproof connector x 1
- Plastic enclosure x 1
- TO-220 package ST L7805CV voltage regulator with heat sink x 2
- 5/12 V cooling fan x 2
- 4.7k resistor
- M3 nuts and bolts
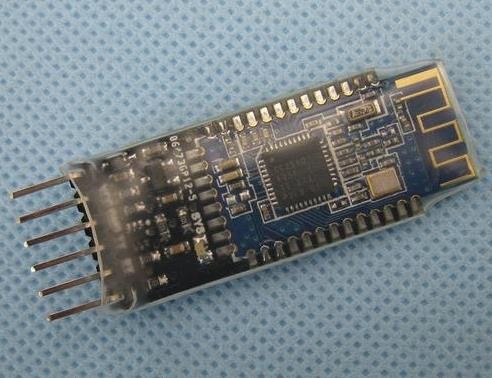
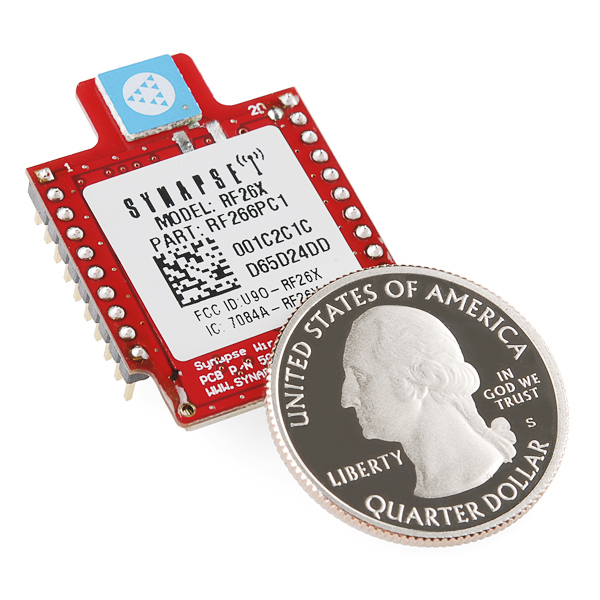
- HM-10 BLE Bluetooth 4.0 module x 2 OR Synapse RF266PC1 RF module + XBee Explorer Regulated x 2
- Fibreglass cable sheathing
- Automotive crimped terminals (assorted)
Please note that the amount of sensors you wish to use is up to you, which means the quantity of them plus the matching connectors will also vary.
Resources
- Arduino IDE
- 4D Systems Workshop 4 IDE
- Synapse Portal IDE (if using Synapse RF266)
- Breadboard and jumper cables
- USB FTDI cable (Bluetooth) OR Sparkfun XBee Explorer USB (Synapse RF266)
- Soldering iron and associated tools
- Electrical tape
- Multimeter
- Hot glue gun
- Drill and drill bits
- Small files
- Epoxy glue
- Screwdriver, spanners, scissors, etc
Selected Data
I chose to read and display the following:
- Oil pressure
- Oil temperature
- Coolant temperature
- Inlet charge temperature pre-intercooler
- Inlet charge temperature post-intercooler
- Wide band 02 sensor
My Innovate MTX-L gauge has a 0-5 V output that I will feed directly into the cabin mounted Arduino. Although the gauge already displays the data in real time, I think it will be nice to have a graph of data over a recent time period to observe.
Further data that could be collected:
- Fuel pressure
- Boost pressure
- Exhaust gas temperature
- Ambient air temperature
As long as you can find a sensor that runs on 5 V, the Arduino should be able to read it and pass on the value to the 4D Systems display.
Hello World
The first job was to get a proof of concept using with only one sensor and the screen. Multiple sensors and wireless connectivity can be added later. The more you try and add at once, the harder it is to troubleshoot if something is awry.
My first surprise was the operation of the temp proves. I expected to have a 5 V, ground and signal wire that was read as an analogue voltage by the Arduino. Instead, I discovered that it uses a one wire communication protocol to digitally request and and receive data. The following libraries need to be added to the Arduino IDE (both are available in the built in library manager):
- OneWire
- Dallas temperature sensors
The OneWire library can be included then ignored. It will be used by the Dallas library and you need not examine or understand the code. The Dallas example sketches have functions for searching for temp probes on all of the input pins and then spitting out the pin and byte signature of the probe. They also have them for reading and printing temperature to the serial. Connect the data wire with a 4.6k pull up resistor as instructed. Adapting these example sketches quickly had me reading the temperature in the room and outputting it to the serial monitor.
The next step was to build a simple interface in ViSi-Genie. I included the main displays I was interested in using: bar graph, scope and text. When you plug the LCD into the programming board and build the code, some will be sent to the flash memory via the programming cable/board and then it will prompt you to insert the SD card so the graphics resources can be saved. One thing you need to get right is setting the baud to the recommended 200,000 to later be matched in Arduino.
The final step was to create the Arduino sketch to take the temperature reading and output it to the LCD. A further library is required which must be downloaded and installed manually:
I used their example sketches once again as the basis of my work, as well as the app notes for Arduino ViSi-Genie library. Apart from the setting the serial baud at a matching 200,000, the components created in ViSi-Genie must be referred to by the correct name:
temp = sensors.getTempCByIndex(0);
genie.WriteObject(GENIE_OBJ_GAUGE, 0, temp);
The above snippet reads and stores the temperature from the probe in a variable, then instructs the Arduino host to send it via serial to the LCD. The WriteObject method is common for all of the available elements, only the capitalised GENIE_OBJ_* argument needs changing to match the name of the component in ViSi-Genie. These components are listed in the linked app notes PDF above. The ‘0’ argument refers to the index of that element. If there were multiple gauge components, the first would be 0, the second would be 1 and so forth. The final argument is the value to write.
The only other issue I encountered was needing to add a delay between screen refreshes. If I tried the run the code without this the screen would fade to white until I power cycled (note: I had a similar problem later on that ended up being low supply voltage). I removed the example code to reset the screen on start up as it made it clunky. One final note is that the LCD must be unplugged from the Mega to update the Arduino code as the LCD and USB cable to the computer use the same serial connection. When the LCD is plugged in the computer won’t be able to access the Arduino Mega because the TX and RX pins are already being used.
The hello world program can be seen in the image below updating the bar gauge, scope and LCD text. The ‘O2’ text is static and will be used to label things later on:

The sketch code is reproduced below:
// Include the libraries we need
#include
#include
#include

// Data wire is plugged into port 10 on the Arduino with 4.6k resistor
#define ONE_WIRE_BUS 10

// Create temperature variable
float temp;

// Setup a oneWire instance to communicate with any OneWire devices (not just Maxim/Dallas temperature ICs)
OneWire oneWire(ONE_WIRE_BUS);

// Pass our oneWire reference to Dallas Temperature.
DallasTemperature sensors(&oneWire);

// Create genie object
Genie genie;
#define RESETLINE 4 // Change this if you are not using an Arduino Adaptor Shield Version 2

void setup(void)
{
 // start serial port at 200,000 baud
 Serial.begin(200000);
 genie.Begin(Serial);

 // Start up the sensor library
 sensors.begin();
}

void loop(void)
{
 // request to all devices on the bus to get temperatures
 sensors.requestTemperatures();
 // We use the function ByIndex, and as an example get the temperature from the first sensor only. Store in temp variable.
 temp = sensors.getTempCByIndex(0);
 // Send to LCD
 genie.WriteObject(GENIE_OBJ_GAUGE, 0, temp);
 genie.WriteObject(GENIE_OBJ_SCOPE, 0, temp);
 genie.WriteObject(GENIE_OBJ_LED_DIGITS, 0, temp*100);
 // delay to prevent white screen
 delay(100);
}
Next Step – Two Temperature Probes
My next aim was to have the Mega read from multiple probes. This could definitely be achieved by using multiple input pins but from what I had learnt about the one wire protocol, they can run on a single pin as each is uniquely identified with a signature. After some minor troubleshooting the test was successful. I separated the LCD and based my sketch on the “Multiple” Dallas example library sketch. After running their code to print out the address of each probe, I manually inserted the addresses into my sketch to cut down on a great deal of code. This sketch outputs to the serial monitor of the laptop.
#include
#include

#define ONE_WIRE_BUS 10
#define TEMPERATURE_PRECISION 9

OneWire oneWire(ONE_WIRE_BUS);

DallasTemperature sensors(&oneWire);

DeviceAddress temp1 = { 0x28,0xD4, 0xE4, 0x26, 0x00, 0x00, 0x80, 0x36 }, temp2 = { 0x28, 0xCC, 0x34, 0x04, 0x00, 0x00, 0x80, 0xE5 };

float t1, t2;

void setup() {
 Serial.begin(115200);
 sensors.begin();
 sensors.getAddress(temp1, 0);
 sensors.getAddress(temp2, 1);
 sensors.setResolution(temp1, TEMPERATURE_PRECISION);
 sensors.setResolution(temp2, TEMPERATURE_PRECISION);
}

void loop() {
 sensors.requestTemperatures();
 t1 = sensors.getTempC(temp1);
 t2 = sensors.getTempC(temp2);
 Serial.print("1: ");
 Serial.println(t1);
 Serial.print("2: ");
 Serial.println(t2);
}
Reading and Passing the Data From Mega to Mega
Since there would be two micro controllers in the car, I needed to start testing how the data would be passed from one to the other. The planned Bluetooth modules use a simple serial connection, so I setup this in the sketches for the engine and cabin Megas on the second hardware port (Serial1). Jumper wires were connected between them with the sender set to relay the temperature data of each probe one after each other. At the end of the cycle, the sender writes the character ‘z’. The receiver is programmed to keep on reading the Serial1 buffer until the z is received, which produces a string with the data one after each other. It then breaks up the data into the various sub strings, converts them to integers and passes them back to the laptop. Most readings will be double digits, but the code must be robust enough to account for single and triple digits too. Sending three digits per probe is the safest with a zero padded for double digits (eg. ’56’ > ‘056’) and two zeros padded for single digit data (‘4’ > ‘004’). Testing this successfully with the Arduino serial port monitor is shown below:

At this point the transfer over the main serial port to the LCD stopped working. I downloaded the tutorial code from 4D systems and stripped it back, introducing my code and testing after each change until the temperatures would come up on the display gauges. I worked out at this time that it’s good to have a debug text string element to spit data out of instead of changing the code to output to the serial back to the laptop. I have no idea what broke the first time but all that matters is that it was working again.
Introducing Bluetooth – A Lesson in Frustration
Now that I could confidently read from sensors and display to the LCD, it was time to introduce the wireless transfer of the data. I opened up the two Bluetooth modules and this is where the headaches began. Each unit needed to be programmed using ‘AT mode’ to set up and automate pairing. The idea is to set one as a master and the other as a slave with each knowing each other’s unique MAC address for pairing. I initially assumed they were the ubiquitous HC-05 modules that many of the online tutorials covered. I could not get any response whatsoever. I rechecked the eBay listing and found that they were meant to be HM-10 modules instead. Some serious time wasted from my own oversight.
To enter AT mode, the device needs to be connected to a serial port monitor at the correct baud and settings. I tried to do this following tutorials using an Arduino Uno as a serial converter in several ways. At one stage I got back the ‘OK’ confirmation but shortly after couldn’t repeat my success. I then remembered I had an USB FDTI cable to omit the Uno and connect directly. Setting the Arduino serial monitor to 9600 baud and “Both NL & CR” had me connected to the modules reliably. Success at last, but still a lot of time wasted.
I looked up tutorials for HM-10 and found that you could type ‘AT+HELP’ to retrieve a list of commands. The commands listed did not match those given in the tutorials for pairing. At the bottom was a website: www.bolutek.com. This was in Chinese and useless to me, but googling it and HM-10 revealed that my module was a copy instead. This page had screenshots which matched my Bolutek ble-cc41-a module and most importantly had the datasheet with a explanation of some of the available AT commands (it ends at page 4 which doesn’t cover everything AT+HELP lists). More time wasted, this time at least not my fault. Finally I had something to work with. The hunt was on.
The more googling I did the more I was reading that the CC41 knock off wasn’t going to do what I wanted. I found some guides for flashing the proper HM-10 firmware onto the module and decided to take a punt. This was a tricky process with an Arduino Uno needing to have a sketch put on it to run in conjunction with a PC program. The Uno needed to be connected to 5 pins of the module – but not the nicely accessible headers down the bottom, but the tiny little contacts underneath the clear heat shrink like shown here:
I cut off the clear heat shrink and tried holding the jumper leads against the proper pins. This was impossible, with no response from the PC software. I bit the bullet and soldered the ends of the jumper wires in place. Everything was connected and I fired up the command line again and the firmware update actually started to happen! Part way through, two of the soldered jumper wires snapped off and the flash failed, bricking one of the Bluetooth modules. I was pretty frustrated and angry at this point.
If I were buying Arduino compatible Bluetooth modules again, I would buy them from a reputable electronics shop such as littlebirdelectronics. This would ensure I got the eact product I wanted with available guides to follow instead of some rip off like the eBay junk I ended up with.
An Alternative – Synapse Wireless Modules
In my projects drawer I had about half a dozen Synapse RF266PC1 modules. These are designed to transmit on the 2.4 Ghz frequency range and have built in processors that Python code can be written for. They can be programmed to read from the IO pins, process data and output to the IO pins like an Arduino. In my previous application I was using them to transmit single bytes of data across several hundred metres. The Python code written to them was simply to pass through whatever was fed in as I was driving that project with Arduino micro controllers too. This means they were ready to go for this project.

Previously, they were set at quite a low baud of 2400 to extend their range, which was fine for single byte transmissions, but not for my 16 character string. I downloaded the Synapse Portal IDE to my laptop and dug up the old code to modify. Please note you need a XBee Explorer USB to interface with the computer and a XBee Regulated Explorer for each module to act as a breakout board for easy wiring to the other electronics. You can wire direct but the pin spacing is narrow and won’t fit a normal prototyping shield.
The Synapse software is pretty clunky. I find it no where near as intuitive as Arduino and other electronics interfaces. The help menu has several pdfs to read through, which are needed to achieve basic operation. Important things to understand are that like an Arduino, the RF266 modules come with no code and are useless until you put some on there. Once you do, they will no longer be recognised by Synapse Portal until you factory reset them by connecting them to the software via the Explorer USB and shorting the reset pin to ground when prompted. Only then can you upload your code and use them with the Arduino serial connection.
The code below is what I flashed to each module. It sets up some parameters, tells them to transfer any data from the physical pins to wireless and vice versa. This ‘multicast’ mode means that any Synapse device with the same code can listen and communicate on the ‘conversation’, but I doubt anyone will have them in a car next to mine to upset my transmission. You can pair them to another device exclusively by unique address if you want to but I thought it unnecessary.
from synapse.switchboard import *

@setHook(HOOK_STARTUP)
def startupEvent():
 saveNvParam(13, 0)
 saveNvParam(14, 110)
 saveNvParam(15, 5)
 saveNvParam(50, 0)
 initUart(1, 1) # <= put your desired baud rate here! '1' (2nd argument) is shorthand for 115,200
 flowControl(1, False) # <= set flow control to True or False as needed
 crossConnect(DS_UART1, DS_TRANSPARENT)
 mcastSerial(0x0001,0)
The above code is Python, which means line indentation is vital. The baud is set to a high (for these devices) 115,200 to speed up transmission. The lower you set the baud with these, the longer the range. Going only a metre or so from the engine bay to the dashboard should be fine for this setting. Multicast mode also means I can listen in on the data from my laptop with a spare module. This means I could potentially write data logging software. I could also transmit dummy signals to the dash module to test the operation.
Refining the Code
All of the individual pieces of the project had been developed to the point of functioning. I could measure multiple temperature probes, format them in a string, transmit wirelessly, receive this string, break it up and update the LCD gauges accordingly. The next part was boring and involved beefing up the code to support all four temperature sensors, the oil pressure sensor and the air fuel ratio from the wide band gauge. The oil pressure and AFR inputs were both analogue signals that needed to be read by the Arduino and then converted into meaningful numbers. The ‘analogRead’ function returns a 0 – 1024 integer scaled to correspond to a 0 – 5 V input. A 2.5 input would therefore return a 512 value.
Each of the sensors came with instructions on how to interpret their analogue signal. Fortunately they were both linear equations.

I used built in Arduino functions to translate the signals. I’ll go through the oil pressure sensor as an example, which gives 0 psi at 0.5 V up to 150 psi at 4.5 V.
This means ‘analogRead’ should return an integer between 102 and 922 (0.5 to 4.5 V). We then use the ‘map’ function to translate that to between 0 and 150 (The range of the gauge). Finally, we use the ‘constrain’ function to limit results to between 0 and 140, as 14o is what I’ve setup the max value for the gauge on the LCD display. ‘p1’ is the integer variable, and ‘A0’ is the pin that is read:
p1 = map(analogRead(A0), 102, 922, 0, 150);
p1 = constrain(p1, 0, 140);
The code for the AFR is very similar, but resides on the ‘receiver’ Mega as the wire for this is already in the cabin.
Finalising the Design in ViSi-Genie
The time had come build the proper interface in ViSi-Genie. I prioritised oil pressure, oil and water temperature as these were the things that if out of a normal operating range could destroy the engine. These were arranged as ‘cool gauges’ across the top of the screen, 240 pixels each in diameter. The range was set from 0 to 140, which should be spot on for operating conditions of the car.
The two inlet temperature gauges were put in the lower left, smaller in size than the first three, but again in the ‘cool gauge’ style. Finally, I set up a ‘scope’ in the lower right and a ‘gauge’ in the far lower right for air fuel ratio. The Innovate MTX-L already has a live read out so this is more about using the scope to show the history of the reading. After a drag run, I can glance down and evaluate the mixtures over the course of the run. The program was complied and sent to the LCD, as well as the graphics saved to the SD card.
A quick update to the Arduino code had all of the elements animating as needed.

Wiring
At this point the transition needs to occur from bread board and jumper wires to final soldered wiring. I had a Mega shield, but it didn’t have rails for 5V and ground, meaning that I had to solder in a piece of metal to do it myself. I instead found a smaller Uno shield from another project and desoldered everything from it to reuse in this project. A solder sucker and solder braid are essential for removing all of the old solder. A newly bare prototyping shield can be seen below:

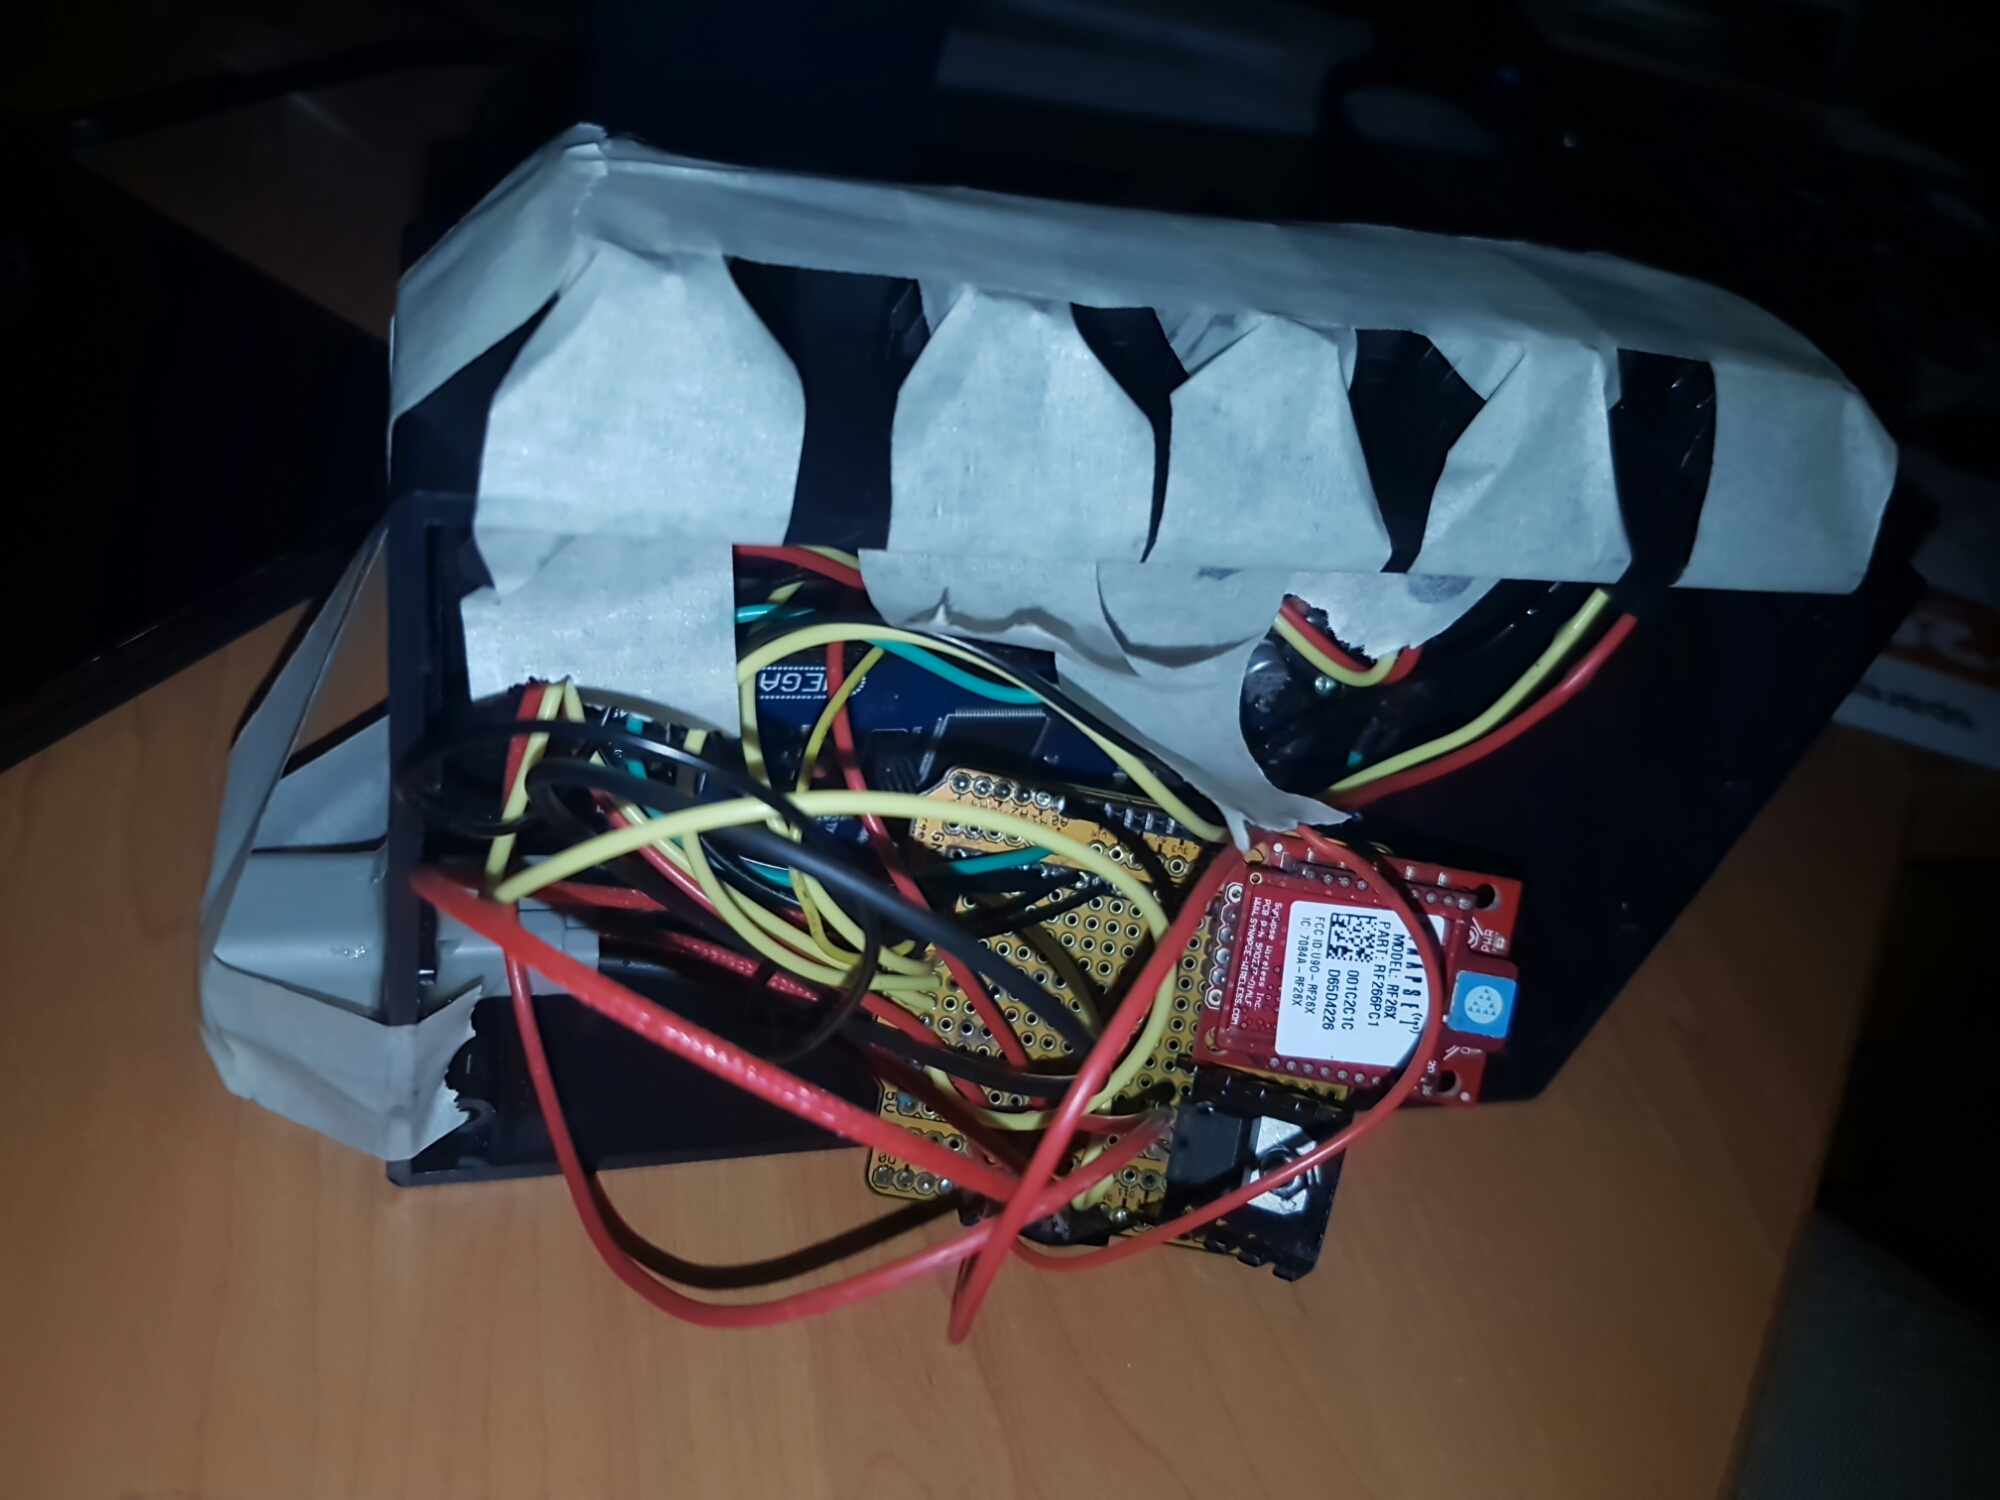
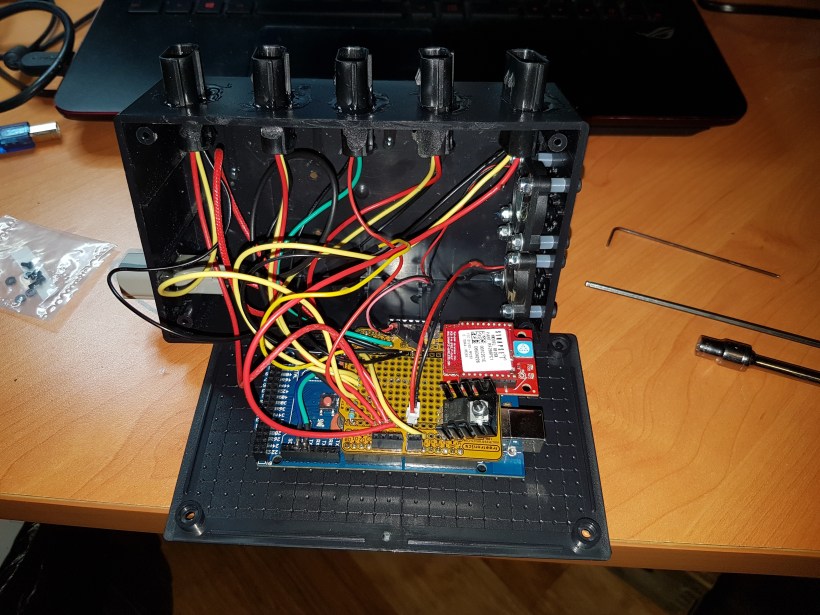
The Mega being used in the cabin came with its own mini shield to connect the LCD, but I still needed to connect the Synapse wireless board. I set up two sets of 90 degree headers, soldering onto their short ends and then heat shrinking over the top for insulation. Finally, some straight headers were soldered into unused pins on the Synapse RF266 board to plug into unused pins on the Mega. The end result is fairly neat:

The engine bay Mega is a lot more involved. It needs five sets of 5 V, ground and signal to go to the five waterproof three pin connectors. The four temperature prove inputs need to be all on pin 10 with a pull up resistor connected to 5V. I soldered in one end of the resistor and cut the lead short, but then soldered the other and bent it over instead of cutting it off. The makes a common rail that the signal wires can poke through and be soldered to, putting everything on pin 10 with the required resistor. The final result is seen below left. The five sets of 5 V and ground are seen from the top (below right), grouped and ready to be terminated in the water proof connectors. The oil pressure input is green to avoid a mix up later on.


Each Arduino Mega runs on 5 v. A mega can take a recommended input of 7-12 V from the DC connector (which is different to the 5 V USB connector), and a doable but not recommended input of 7 – 20 V. The alternator in a car will provide power in the 14 V range when the engine is running, which will heat the onboard voltage regulator greatly. In time, this might equate to failure. I decided to use a TO-220 package voltage regulator instead. It can take an input of up to 35 V, supply a maximum of 1.5 A (compared to the 0.5 A available from a USB port) and most importantly, the larger body means better heat dissipation, especially with an optional heat sink bolted on. A ST L7805CV is pictured below next to the standard Mega VREG:

The sender Mega had room on the prototyping shield to mount the VREG next to the Synapse module. When looking at the VREG with the writing facing you, the left pin is the voltage in, the right pin is the voltage out. The centre pin is a common ground for the voltage in and out. I mounted the VREG so the voltage out pin fed into the shield 5 V rail. The ground pin has two wires soldered and insulated for ground: one going to the ground rail of the shield and the other not attached at this stage, but ready to wire to the car body ground. The input wire was also soldered and insulated but left loose for wiring to a switched 12 V source in the engine bay.


The receiver Mega was harder because there is no shield to mount the part. I had some generic prototyping board, so I measured, cut and sanded it to fit nicely next to the Synapse module. Each column of the board is connected, so I took care not to solder in headers that would plug into pins which I would be using, or ground and power pins. The extra board allowed me to tidy up some of the other wiring too.

At this stage I connected 12 V from a jump starter battery to each unit and fortunately they came to life as expected.
I used electrical tape to cover all of the pins on the underside of the Mega, and then wrapped some around the assembly in key places to prevent shorting and hold some connections firm. Spade and earth terminals were crimped and soldered onto the ground, 12 V voltage input and AFR input, ready for connection in the centre console. Matching terminals were crimped in place and the unit was connected to the car. I used the vacant stereo wiring for my power source. At this stage, the engine bay transmitter was not finished but the LCD powered up and displayed a smooth AFR trace from the Innovate MTX-L gauge.
The bezel was unboxed and attached to the screen. The bezel and screen fit nicely over the double DIN slot. You could recess it further into the dash by cutting the trim panel around the stereo but I was happy to leave it as is. The bezel comes with a collection of small brackets which are designed to push outwards and wedge into a cavity that is sized to accept them. In other words, useless for this application. The screws and washers could still be used to secure my own brackets to the bezel and then the trim panel of the car.
I found some very thin metal pieces with a hole in each end in my miscellaneous computer hardware drawer. Bending them 90 degrees after the hole had them sitting just inside the trim panel. I then used pliers to bend them around the inner lip of the trim panel. The screen can be removed by flexing them one at a time to disengage. The original car interior is untouched and the install is reversible.


The final mounting position of the LCD in dash is seen below, logging AFR at idle:

Making It Reliable
Some problems immediately became apparent. Firstly, there seemed to be a loose connection which stopped the LCD from starting which could be temporarily resolved by wiggling the wires. Furthermore, after a short while the screen would start to flicker and then white out. Trawling through the 4D Systems forums suggested that a power supply issue was to blame.
I bought the system inside and ran it from a jump starter 12 V battery. I diagnosed the bad connection as a dry joint in the VREG soldering and rectified the situation. Sure enough, after a few minutes the screen started to flicker and I measured the output voltage of the VREG at only 2.2 V. It was extremely hot and on the verge of failure. The decision was made to mount a 12 V fan above the VREG to keep it cool. I had one lying around and used two M3 bolts with washers and lock nuts to stand it off a nice distance. Further testing has yet to repeat the VREG overheating issue. At the same time I used a hot glue gun to coat the base of the 12 V input wires to stop them wiggling and eventually breaking the solder.


Finalising Wiring
Once the 3 pin connectors finally arrived, I dummied up the positions of everything to plan where I would drill and epoxy them. Tape was applied to the box so I could draw on relevant markings and then a drill and small file were used to make the oval cut outs. Now that I knew the VREG needed a fan, planning needed to take place to ensure the fan could circulate some air through venting on the box.
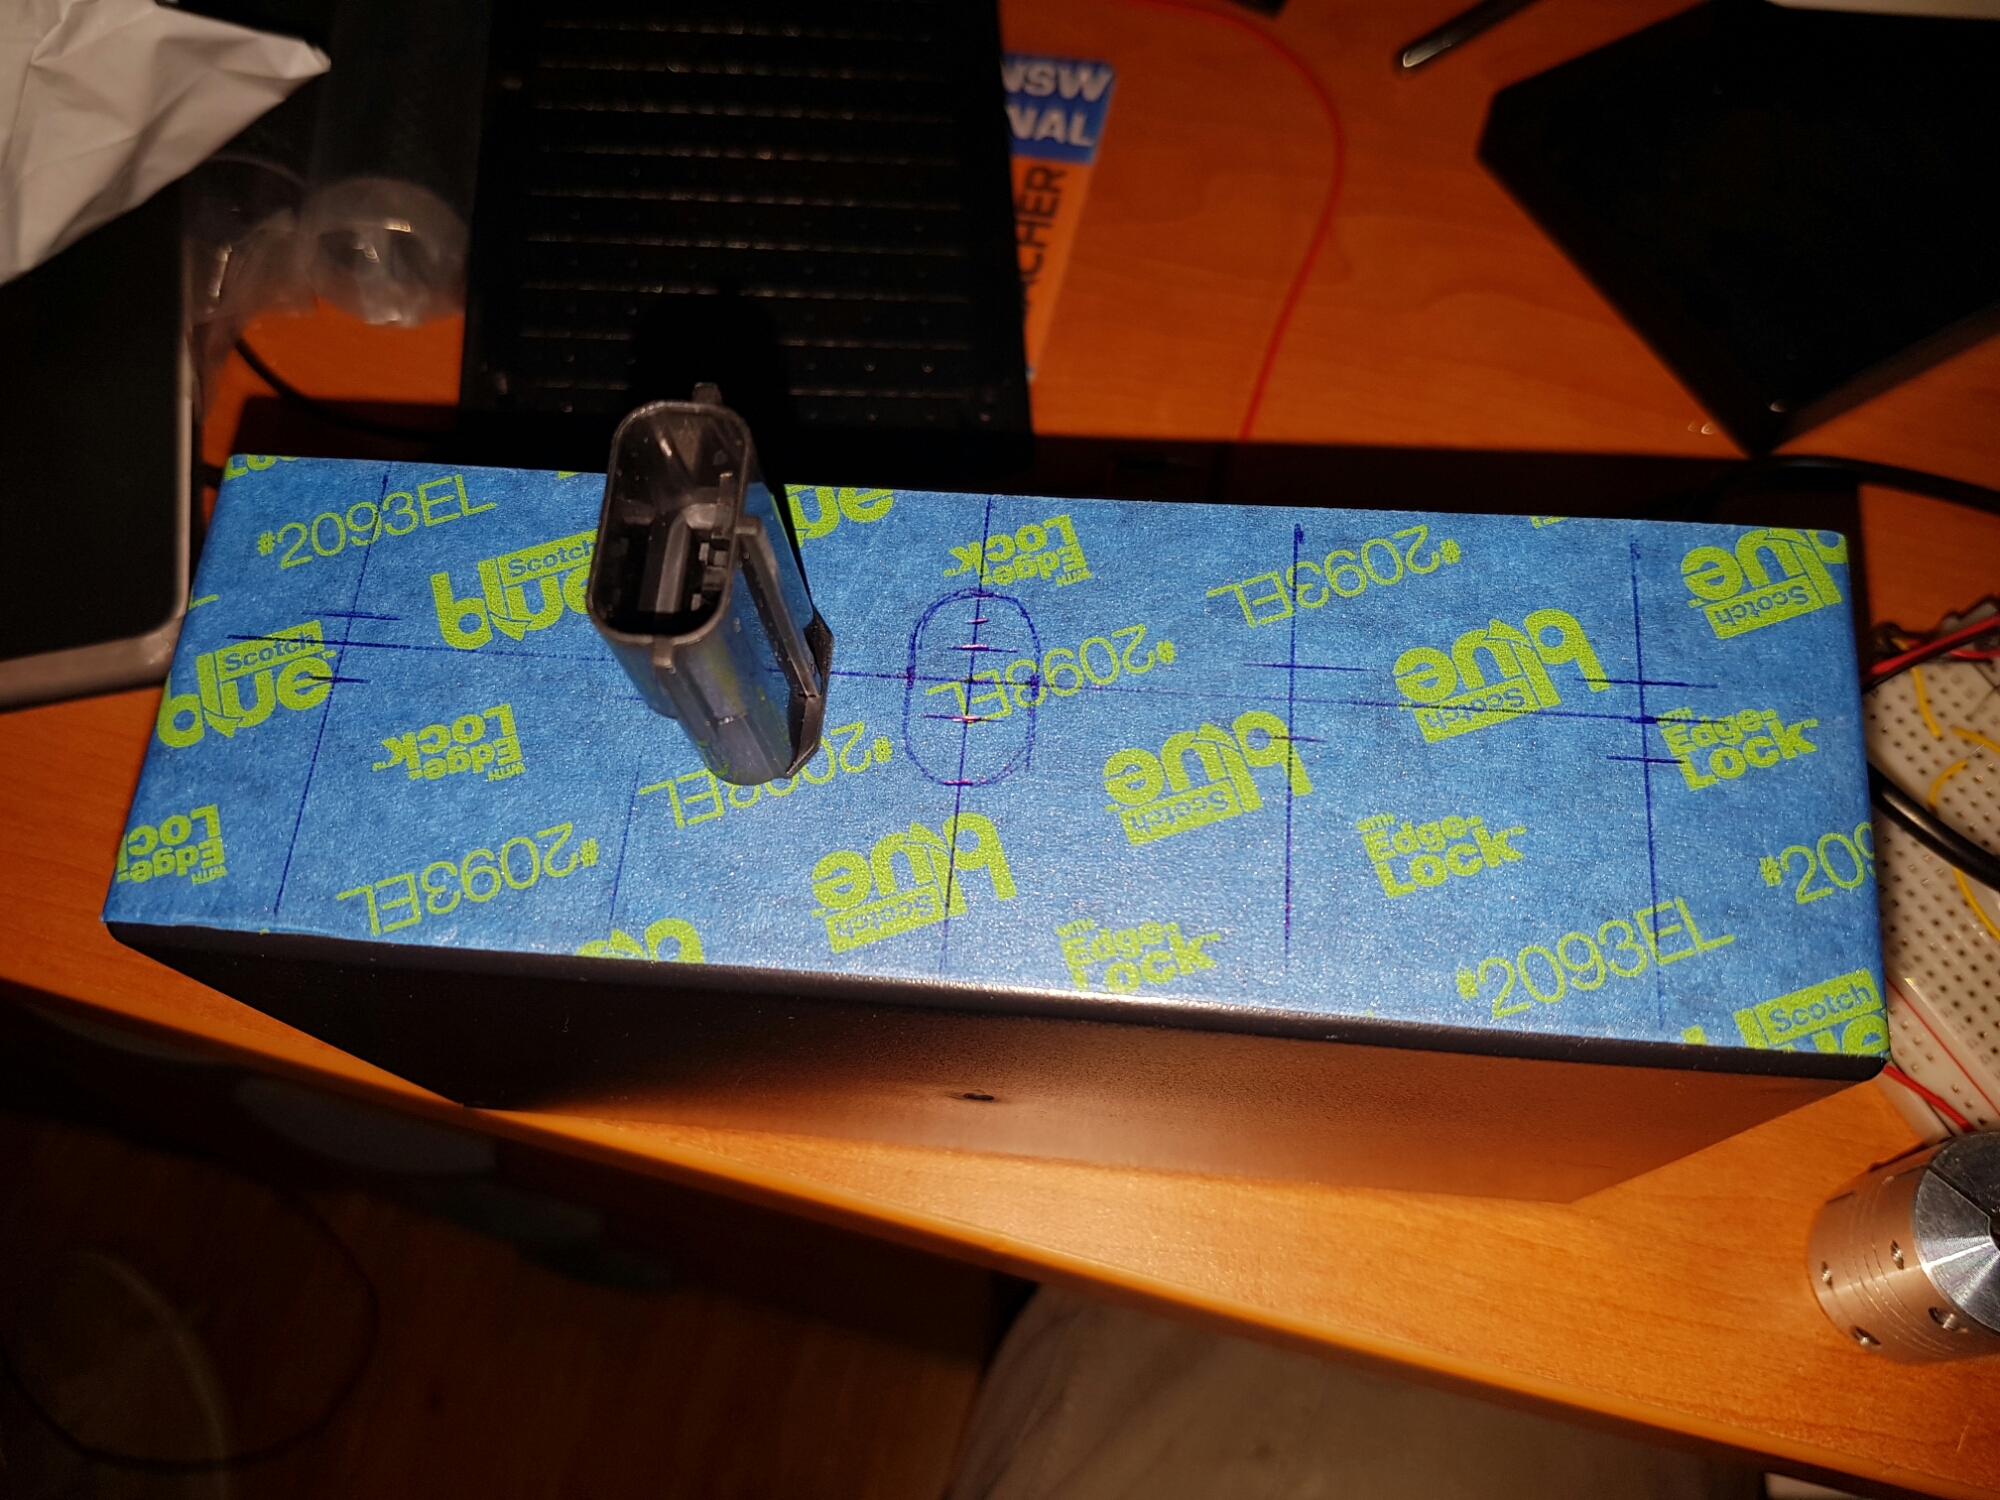
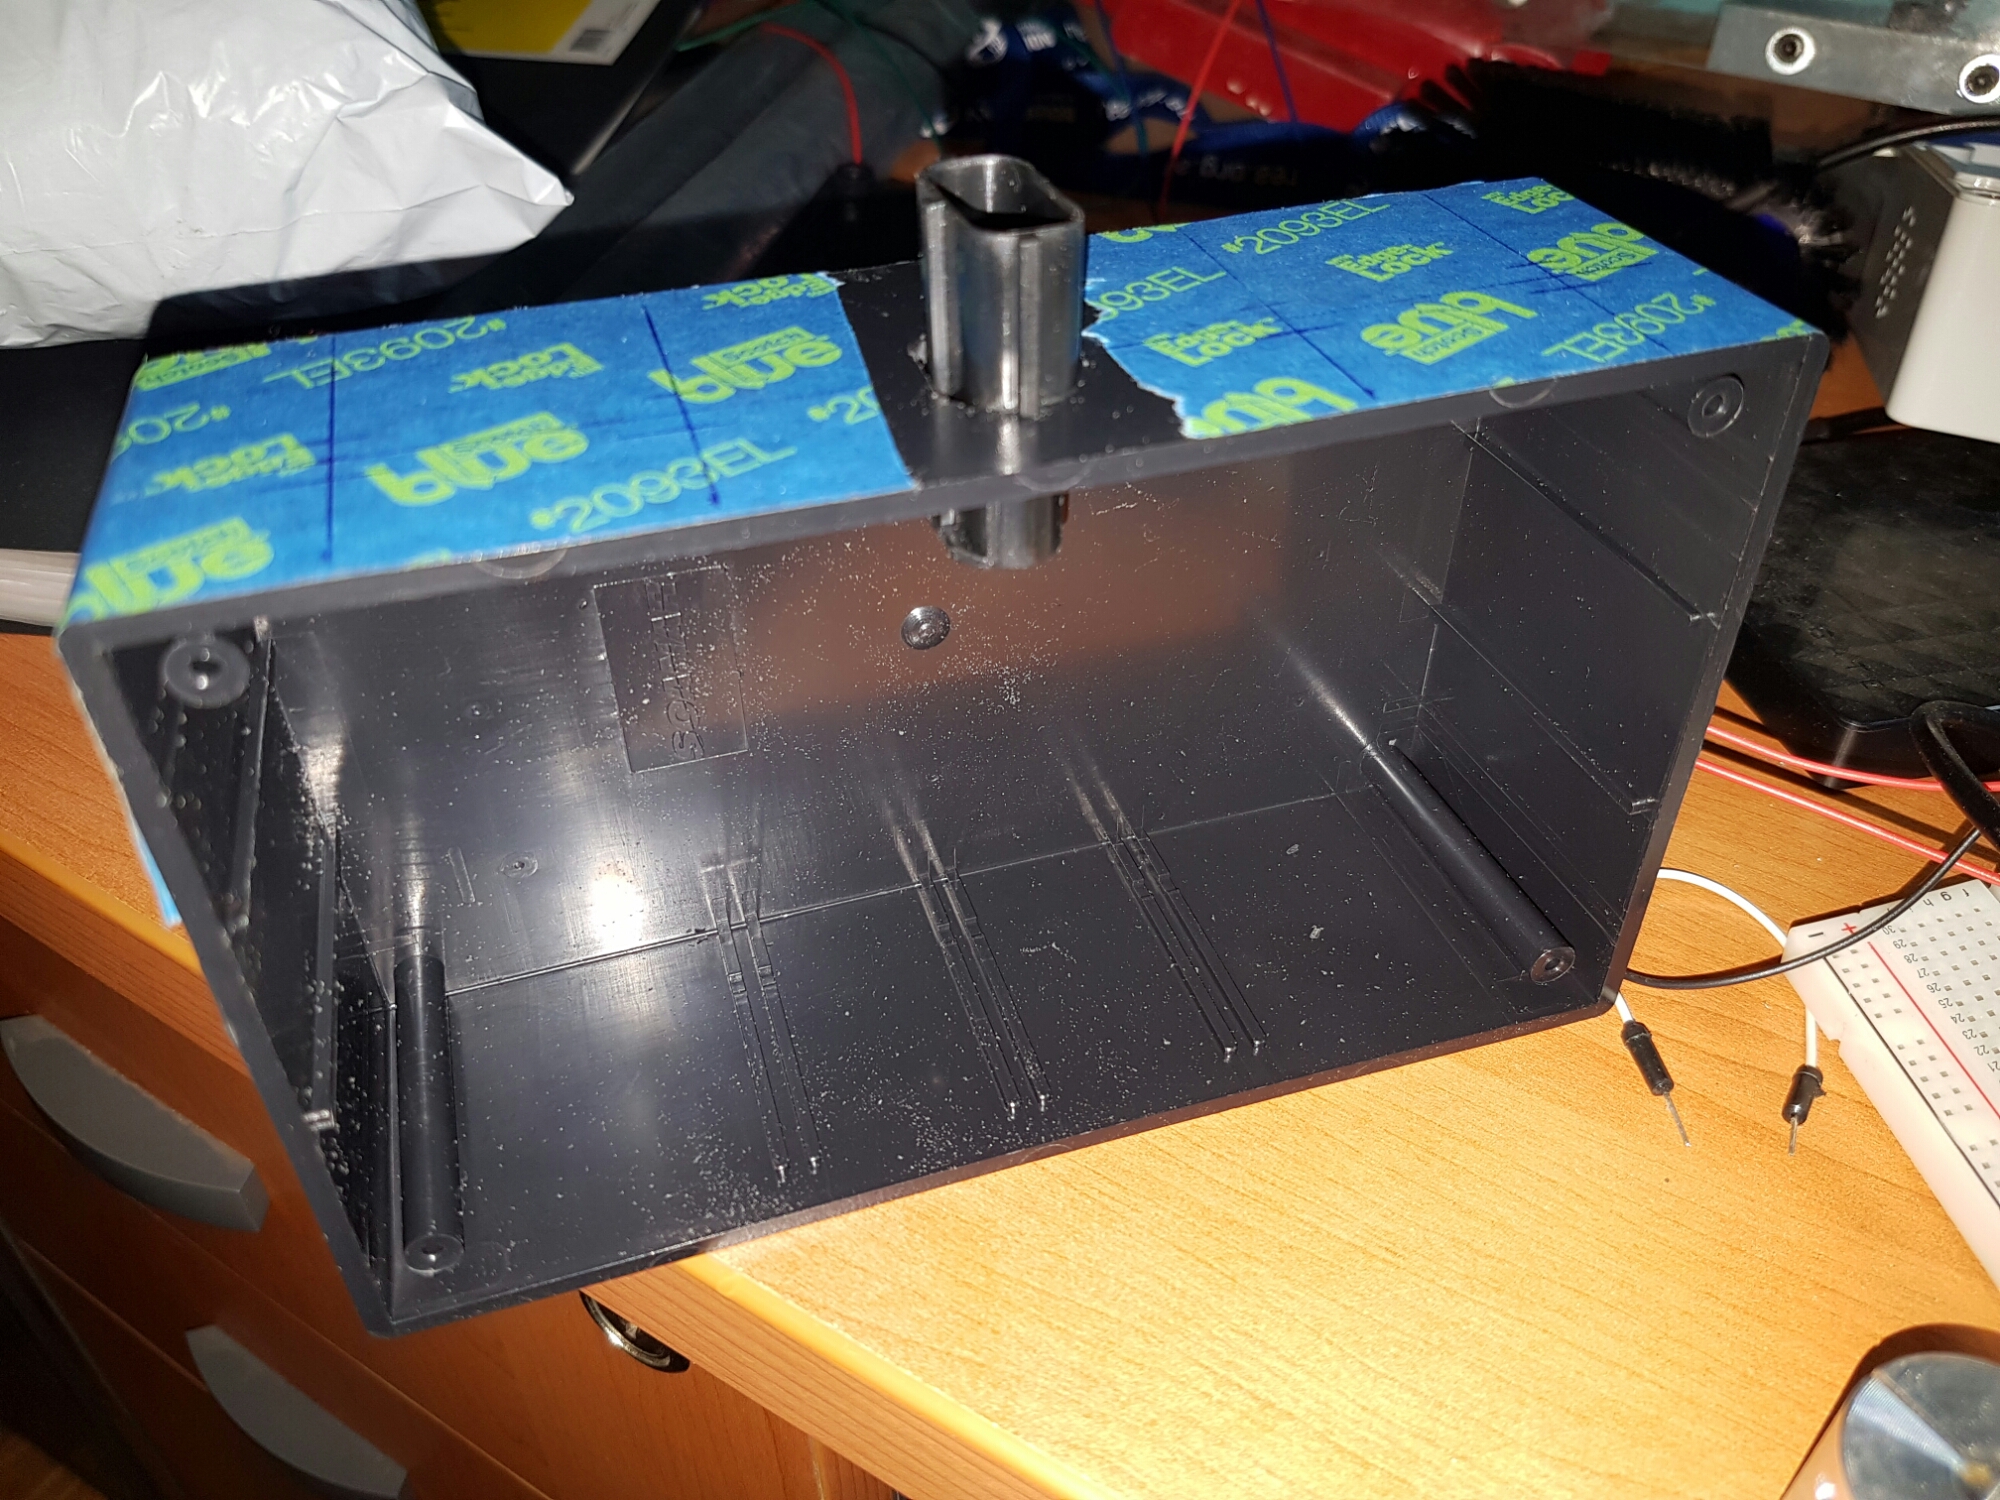
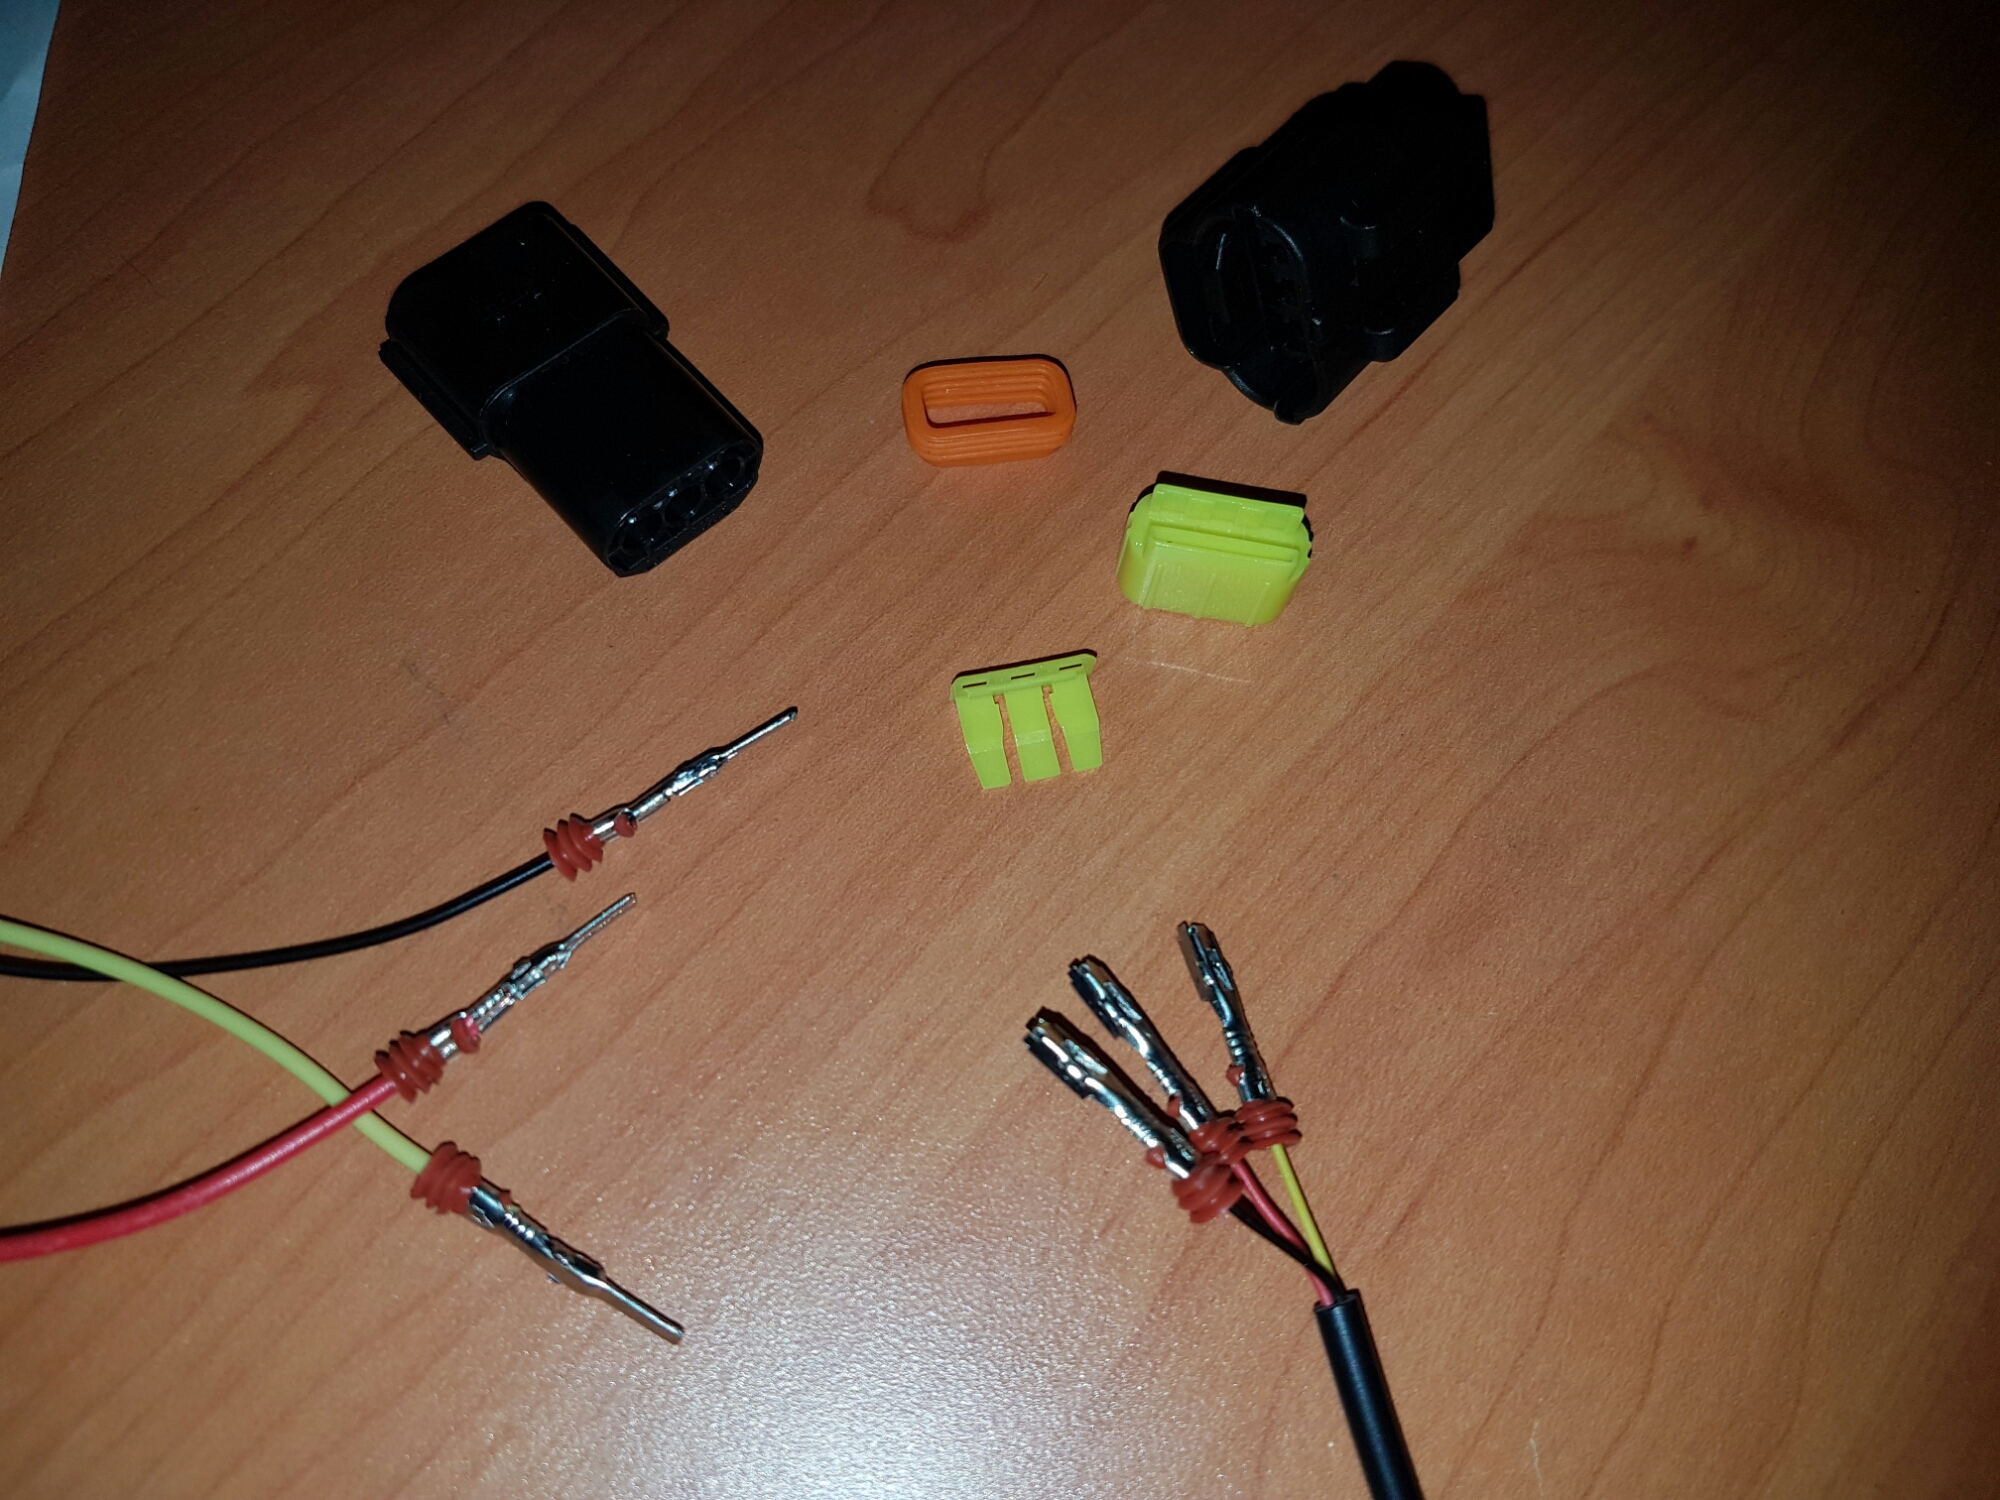
It’s better to wire up the connectors before gluing them in place, so I used a crimping tool to connect the five sets of inputs prepared earlier and the input 12 V and ground. Each wire has a little rubber boot which is crimped in to make it waterproof. Now one half of each connector could be epoxied into the box, secure and waterproof. Only the fan venting would allow in air or moisture but this is a necessary evil.
The epoxy turned out a bit messier than I hoped but the bond is strong enough. Once it had set, I mounted two 5 V fans to the inside of the box. One for air in, one for air out.


Screws were used to secure the Mega inside the box with plastic spacers. Fibre washers were used under the nuts to prevent any chance of shorting the Mega. After finishing this I realised it would not be possible to change the programming of the Mega without major disassembly. More programming was need to find the address of the final probes so the correct order was being sent to the cabin. I pulled it apart and remounted the Mega on the inside of the box lid. This means only four screws are needed to be removed to attain access to the USB programming port.
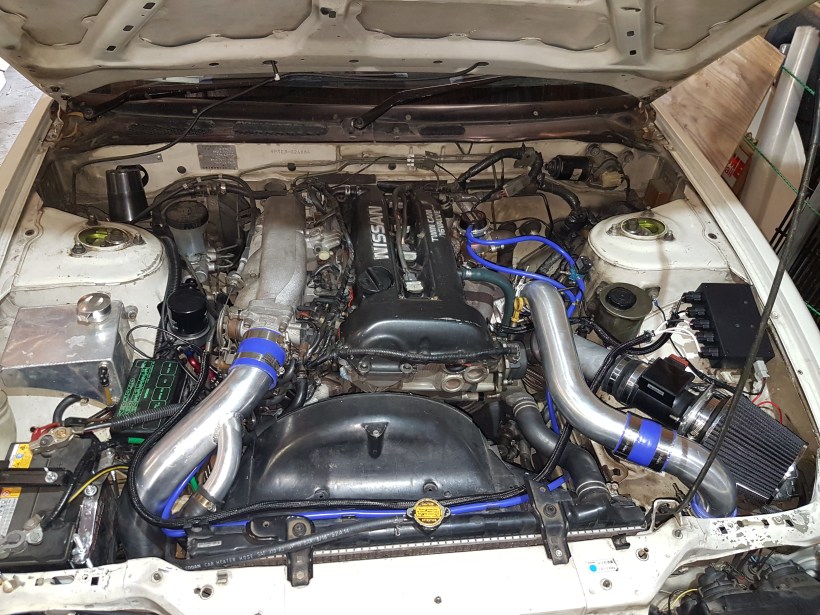
A location was chosen to be as cool as possible as to not aggravate the VREG temperature. This was not as simple as it sounds due to the cramped engine bay. The only place it would fit without major rearrangement was next to the air flow meter. I used tape to trace the vacant air box mounting holes in the chassis, drilling through the bottom of the plastic box and then using 10 mm bolts to secure it. Unfortunately, this position meant three of the five sensors wouldn’t reach with their standard lead and would need extending.


No three core cable was available from Jaycar so I had to buy four core alarm cable. It also had white shielding so I purchased some black fibreglass sheathing to protect and hide the leads. Solder and then heat shrink was used to ensure a reliable extension. I combined the white and blue wires at each junction to not waste anything. It’s always best to make these leads longer than planned, you can always cut them down later.
The final wiring is for the earth and 12 V feed to the engine bay sender. The earth is simple, by way of a crimped ring terminal that is bolted to whatever takes your fancy. The 12 V positive is harder because it needs to be switched with ignition or accessory to prevent the unit draining the battery while the engine is off. After poking around in the fuse/relay boxes with a multimeter, I discovered the air con labelled relay in the box near the MAF provided an accessory switched 12 V. Since I don’t have air con, I removed the relay and plugged my crimped spade terminal into one of the vacant connections.

Preparing and Mounting the Sensors
Each probe comes without any threaded fitting, so a hole needs drilled in a bolt and then epoxy applied to seal it. Their diameter is about 5.9 mm so a 6 mm drill bit makes for a snug fit. The water temp and oil temp probes were mounted in a tapered thread bolt with epoxy. I purchased some M12 nylon nuts and bolts for the two inlet temperature probes. Each were cut and sanded down to make them more slimline (before and after shown below). After this, epoxy was again used to seal everything up.

The oil temperature probe and pressure sensor were previously mounted in the remote oil filter assembly and simply needed their leads extended and crimped into the new connectors.

The final job was to remove two of the intercooler pipes to drill 12 mm holes for the nylon nuts and bolts to go through. They will seal a lot better if they have flat surface to seat on. To achieve this, A nut, bolt and washers are tightened in the hole to try and flatten the local area (far left). These are removed before some gasket goo was then applied to the nylon fittings to try and get a boost proof seal (centre left) and the pipes reinstalled.


Fibreglass sheathing and cable ties were added to tidy everything up. It is important to ensure there is no strain on any of the plugs. The final install is shown below. The oil pressure, oil temp and throttle air temp travel across the fan shroud in the black sheathing to the control box near the air filter. The post turbo air temp and water temp sensors also have some sheathing to protect them from exhaust heat.
Final Calibration and Refining the Code
You initially need to run the ‘Multiple’ sketch from the Dallas temperature library with one probe plugged in at a time. This will print the address of each probe to serial, ready for copying and pasting into the transmitter sketch. The final step is to verify the correct probe is being displayed to the correct gauge by the receiving Mega. Unplugging them one at a time to see which goes to zero on the LCD will confirm. Some little tweaks may be needed to get the right order of data in the following commands:
 sensors.getAddress(temp1, 2);
 sensors.getAddress(temp2, 1);
 sensors.getAddress(temp3, 0);
 sensors.getAddress(temp4, 3);
These were my final values with the last argument switched to make the temperatures display as desired on the LCD in the dash.
I was now unhappy with the speed of the system. The refresh rate was only about 8 fps, which looked noticeably jerky. I started playing with variables to find the bottle neck. At first it was the temperature probe reading. After some googling I discovered that I could change a parameter in the Arduino library to speed up operation.
sensors.setWaitForConversion(false);
This made the transmission lightning fast.
The problem now was the transmission was so fast that multiple packets were queuing up as the receiver processed them and updated the LCD. I implemented many changes to try and formalise the packets and add validation but as the Arduino stopped attending to the serial port to do other things, characters were being missed. Instead of a string containing 15 numerical digits followed by a ‘z’, some would be longer and some would be shorter. This meant the parsing would produce bogus values to send to the LCD which would then momentarily cause the on screen gauges to display a red cross as the values were out of range. Very frustrating.
Early on I tried two way communication, where the receiver would send a confirmation message for the transmitter to send the next packet. This was 100% reliable but only ran at 5 fps. I abandoned this idea but eventually had to come back to it as I couldn’t get anything else to work reliably.
The next step was to find out where the bottle neck was in the new configuration. I quickly traced it to the updating of the LCD. Research told me that the 7 inch model had a full screen frame rate of just over 3 fps. The less it has to redraw, the faster the frame rate. Redrawing half of the screen would be ~6 fps, a quarter ~12 fps, etc. The key was to minimise the screen area redrawn every cycle. My design had eight elements being redrawn each cycle, which covered most of the screen. Frustrating because you want your elements to be as big and informative as possible but this brings a speed penalty.
Finally it dawned on me that all I had to do to hugely boost performance was to have a second set of variables that stored the previous values, compare the new ones to them and only update the LCD elements that had changed. If the old water temp reading was ’45’, then the gauge would not be updated until the new reading was something different. When in the car, most of the temperature gauges will only change every few seconds at most, therefore on an average cycle, only the oil pressure and AFR will be redrawn and the cycle will be a lot faster. At worst, the frame rate will be about 5 fps.
The final thing I had to do was to add a bit of waiting time at the start of the loop for the incoming packet, as minimal screen updates mean that the new cycle was fast enough to happen before the next packet arrived. The gauges were flickering between the proper values and zero over and over. This smoothed everything out nicely.
After the first proper drive with the LCD, it was hard to read the screen properly due to glare. I could see it if I removed my sunglasses, but bright conditions were when I needed them the most. I had previously set the LCD at a bright of 11 out of a possible 15. One idea was to have max brightness and then an auto dim turned on by the headlights, but I didn’t want to have to install a second 5 V VREG to create a 5 V signal. Another idea was to have a light detecting resistor that automatically upped the screen brightness to match ambient.
I ended up wiring in a potentiometer because it was the simplest option. The outside pis receive 5V and ground, the middle pin goes to A1 on the Arduino. At the start of the loop, the Mega reads the A1 analogue input, checks if the reading is the same as last time, and if it isn’t updates the LCD brightness. I can now set the brightness to whatever I like.
Styling Tweak
I planned to spruce up the interface a little at some point, and now was the right time. Each gauge has many colours that can be set. There is no overall preset for red or green appearance, so it’s a tedious process to get the styling right. Rather than going through six gauges and changing the various colours one by one to match, I thought I would experiment with the background.
The plain black contrasted too much with the blue/grey gauges, so I imported an image of brushed aluminium from Google and tweaked the colours of the scope to suit. The debug bar at the bottom was changed to grey and given a width of 1 pixel. It’s still technically there and kind of works but is practically invisible. The default cool gauge elements look a lot better on this new background. A good gain for minimal effort.
Final Product
The video below showcases the final product. I point out the location of the five sensors in the engine bay and then the screen is seen in the dash du:ring warm up
Source Code
The ViSi Genie files: sileighty_lcd_visi_genie
The Arduino code for the engine bay transmitting Mega:
#include
#include

#define ONE_WIRE_BUS 10
#define TEMPERATURE_PRECISION 9

OneWire oneWire(ONE_WIRE_BUS);

DallasTemperature sensors(&oneWire);

DeviceAddress temp1 = { 0x28, 0x47, 0x00, 0x27, 0x00, 0x00, 0x80, 0x94 }; // 2847002700008094 --> oil temp
DeviceAddress temp2 = { 0x28, 0x82, 0xF9, 0x26, 0x00, 0x00, 0x80, 0x3A }; // 2882F9260000803A --> water temp
DeviceAddress temp3 = { 0x28, 0xD4, 0xE4, 0x26, 0x00, 0x00, 0x80, 0x36 }; // 28D4E42600008036 --> air temp post turbo
DeviceAddress temp4 = { 0x28, 0x3F, 0xD9, 0x26, 0x00 ,0x00, 0x80, 0x8F }; // 283FD9260000808F --> air temp before throttle

String dataOut;

int t1, t2, t3, t4, p1;

void setup() {
 Serial1.begin(115200);
 sensors.begin();
 sensors.getAddress(temp1, 2);
 sensors.getAddress(temp2, 1);
 sensors.getAddress(temp3, 0);
 sensors.getAddress(temp4, 3);
 sensors.setResolution(temp1, TEMPERATURE_PRECISION);
 sensors.setResolution(temp2, TEMPERATURE_PRECISION);
 sensors.setResolution(temp3, TEMPERATURE_PRECISION);
 sensors.setResolution(temp4, TEMPERATURE_PRECISION);
 sensors.setWaitForConversion(false);
 sensors.requestTemperatures();
}

void loop() {
 if(Serial1.available() > 0){
 Serial1.read();
 p1 = map(analogRead(A0), 102, 922, 0, 150);
 p1 = constrain(p1, 0, 140);
 t1 = sensors.getTempC(temp1);
 t2 = sensors.getTempC(temp2);
 t3 = sensors.getTempC(temp3);
 t4 = sensors.getTempC(temp4);
 sensors.requestTemperatures();
 sendData(p1);
 sendData(t1);
 sendData(t2);
 sendData(t3);
 sendData(t4);
 Serial1.print("z");
 }
}

void sendData(int d){
 if(d < 0){
 Serial1.print("000");
 } else if(d == 0){
 Serial1.print("000");
 } else if(d < 10){
 Serial1.print("00");
 Serial1.write(d);
 } else if(d < 100){
 Serial1.print("0");
 Serial1.print(d);
 } else {
 Serial1.print(d);
 }
}
The Arduino code for the in dash receiving Mega:
#include

Genie genie;

#define RESETLINE 4 // Change this if you are not using an Arduino Adaptor Shield Version 2 (see code below)
#define DEBUG 0
#define OILPRES 1
#define OILTEMP 0
#define WATERTEMP 2
#define AIRTEMP1 3
#define AIRTEMP2 4
#define AFRBAR 0
#define AFRSCOPE 0

String datain, t1, t2, t3, t4, p1;
int temp1, temp2, temp3, temp4, pres1, temp1old = 0, temp2old = 0, temp3old = 0, temp4old = 0, pres1old = 0, afr1, bright, oldBright = 0;
long j = 0, k = 0;

void setup()
{
 Serial.begin(200000);
 genie.Begin(Serial);
 delay (1000);
 bright = map(analogRead(A1), 0, 1000, 15, 0);
 bright = constrain(bright, 0, 15);
 genie.WriteContrast(bright);
 Serial1.begin(115200);
 Serial1.print("k");
 j = millis();
 //genie.WriteStr(DEBUG, "Initialising");
}

void loop(){
 bright = map(analogRead(A1), 0, 1000, 15, 0);
 bright = constrain(bright, 0, 15);
 if(bright != oldBright){
 oldBright = bright;
 genie.WriteContrast(bright);
 }
 while(millis() - j < 180){  if(Serial1.available()) {  Serial1.print('k');  datain = Serial1.readStringUntil(122);  //genie.WriteStr(DEBUG, datain);  p1 = datain.substring(0,3);  pres1 = p1.toInt();  t1 = datain.substring(3,6);  temp1 = t1.toInt();   t2 = datain.substring(6,9);  temp2 = t2.toInt();   t3 = datain.substring(9,12);  temp3 = t3.toInt();  t4 = datain.substring(12,15);  temp4 = t4.toInt();  j = millis();  k = 0;  break;  } else {  pres1 = 0;  temp1 = 0;  temp2 = 0;  temp3 = 0;  temp4 = 0;  }  }  if(pres1 != pres1old){  genie.WriteObject(GENIE_OBJ_COOL_GAUGE, OILPRES, pres1);  pres1old = pres1;  }  if(temp1 != temp1old){  genie.WriteObject(GENIE_OBJ_COOL_GAUGE, OILTEMP, temp1);  temp1old = temp1;  }  if(temp2 != temp2old){  genie.WriteObject(GENIE_OBJ_COOL_GAUGE, WATERTEMP, temp2);  temp2old = temp2;  }  if(temp3 != temp3old){  genie.WriteObject(GENIE_OBJ_COOL_GAUGE, AIRTEMP1, temp3);  temp3old = temp3;  }  if(temp4 != temp4old){  genie.WriteObject(GENIE_OBJ_COOL_GAUGE, AIRTEMP2, temp4);  temp4old = temp4;  }  afr1 = map(analogRead(A0), 0, 1024, 1, 159);  afr1 = constrain(afr1, 0, 159);  genie.WriteObject(GENIE_OBJ_GAUGE, AFRBAR, afr1);  genie.WriteObject(GENIE_OBJ_SCOPE, AFRSCOPE, afr1);  k++;  if(k > 10){
 Serial1.print("k");
 k = 0;
 j = millis();
 }
}
Version 2 – Boost!
After a trip to the drag strip I noticed some small issues. Firstly, the post turbo air temperature easily exceeded the 100 degrees C set for the gauge. Secondly, the digits on each cool gauge needed a touch more contrast to make them stand out. Lastly, I though it might really be nice to plot boost with AFR on the same scope.
The first two were simple fixes, with quick alterations made in ViSi-Genie. A cheap GM style MAP (manifold absolute pressure) sensor was ordered from eBay to live in the centre console with a vacuum line teed off the boost gauge to feed it.
The GM units have three wires, which 5 V, ground and analogue signal. They are rated to 3 bar, but this is relative to the sealed vacuum inside them which is used as a reference. When exposed to atmospheric pressure (~14.7 psi), the sensor will output around 1.66 volts, or a third of its available range. When exposed to 1 bar of boost from the engine, the sensor will read around 3.33 volts, or two thirds of its available range. The full 5 V output would be reached with 2 bar of boost from the engine. Basically, the sensor factors in 1 bar of atmospheric pressure. Anything less than atmospheric pressure (engine vacuum) would read in the 0 – 1.66 V range.
Calibrating the signal to read boost was the easy part. The scope is 176 pixels tall, with a horizontal line half way up. I needed boost to show above the line from 1.66 V to 5 V. The horizontal line was labelled 0 and the top of the scope 30 psi, with a 10 and 20 psi labels added at even increments.
Vacuum is not read in psi but instead inches or mm of mercury. I found a conversion showing that 1 bar equals 30 in-Hg (inches of mercury, the same unit used on my boost gauge). Therefore, the quarter below half way needed to be labelled as -30 in-Hg, with a 15 in-Hg increment marked too. From the bottom of the scope to the quarter way line would never be used by the scope due to the maths involved.
I used the Arduino map function once again to translate the 0-1023 integer returned by analogRead to a value between 47 and 176. This means 30 psi is the top of the scope, 0 psi at roughly the middle and minus 30 in-Hg a quarter way below half. Powering the unit not attached to the car has the trace right on the half way line, which is perfect.
I taped the MAP sensor to the rest of the in-dash Mega assembly and reinstalled in the car.

After a day trip in very hot weather, some teething troubles were evident. The one scope with the AFR and boost traces together was quite hard to read. At idle, the vacuum trace matches the vertical position of the AFR trace on the scope, making it impossible to distinguish them.
Furthermore, late in the day, the boost signal became stuck at atmospheric pressure. When I got home, I noticed the MAP sensor had burst open from air pressure (below left). Perhaps the hot weather contributed, but the quality of the sensor is questionable. I used two nut, bolt and large washer combinations to force the plastic piece to stay in place (below right).


Next up, I modified the interface in ViSi-Genie and uploaded it to the LCD. The first scope was reduced in size and a second added below it. Each was set to 90 pixels high, which divides beautifully across the 3 bar the MAP sensor reads. The horizontal reference line was set as 1/3 up for the boost scope (0 psi) and 1/2 way up to represent stoichiometric (14.7 psi) for the AFR scope. By leaving them inline, a correlation can be made between boost and AFR at a given time. Slight alterations were required to the Arduino code and a few different colour variations were trialled before the unit was installed back in the car. The completed GUI can be seen below:
Source code for version 2 here: sileighty_lcd_v2
